If you are a bit of a hypochondriac like me, you may be wondering, “What are my odds of dying this year?”.
If you are working on a retirement calculator like this one http://www.calculator.net/retirement-calculator.html, that asks your expected age of death, you may be wondering “How much longer am I expected to live now that I have reached a certain age?”. The longer you live, the longer you are expected to live.
I have created a table that answers these questions. I used data that was created from the 2007 actuarial table provided by the US social security site https://www.ssa.gov/oact/STATS/table4c6.html
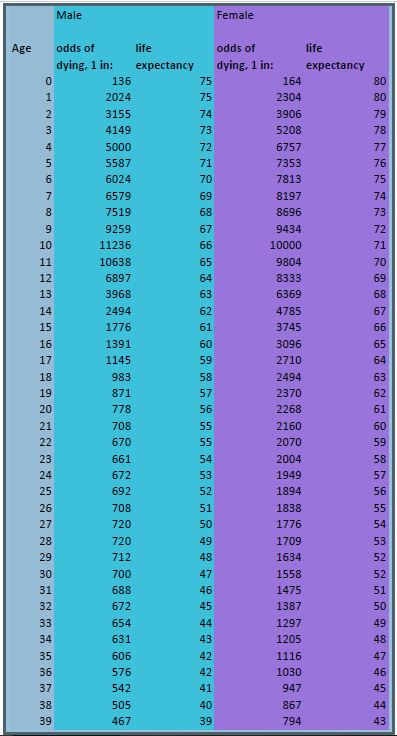
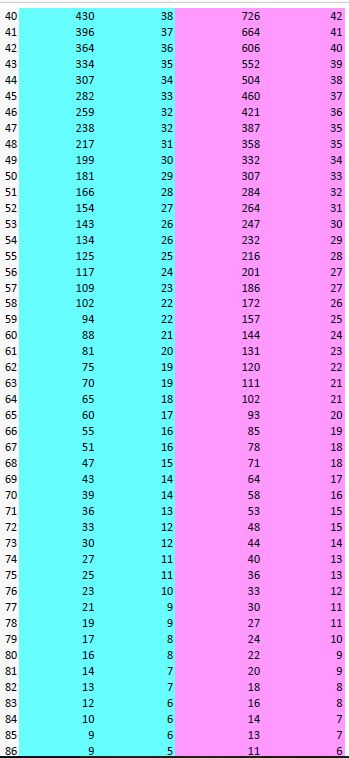
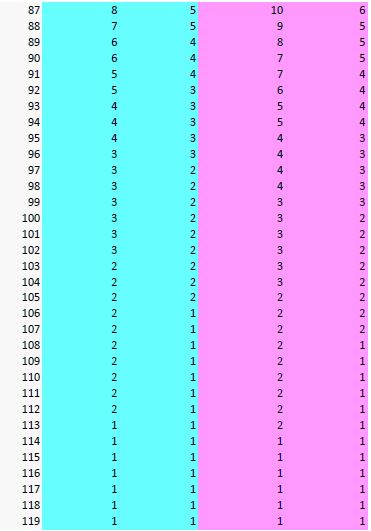
The images show how much longer you are expected to live, labeled “life expectancy”, based on your age and gender. It also shows the odds of you dying based on 1 over that number. Example: if the number says 200 that means you have a 1 in 200 chance of dying that year ( or that if you know 200 people your age, odds are one of them will die that year sadly). So go out and live your life to the fullest if you are getting up there in years like I am!!
Here is the chart in images. Double click on the images to enlarge:
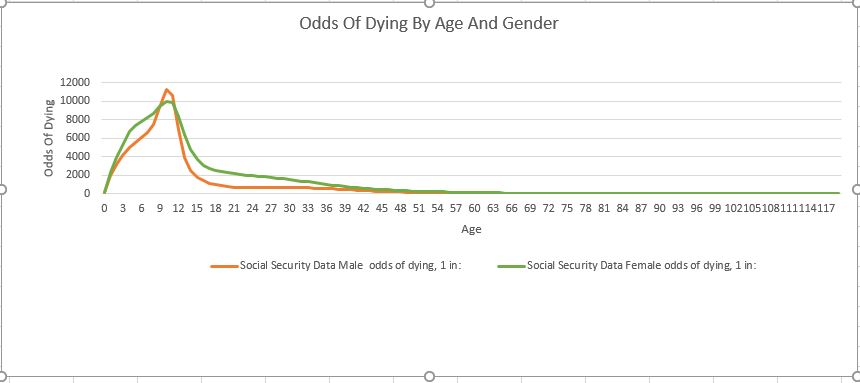
Here is a chart showing just the Odds of Dying by age and gender. As you can see, the odds go way up the older you get. The lowest point is around age 10, when kids are smart enough to not do anything too dangerous and obedient enough to follow guardian’s, parent’s and teacher’s instructions.
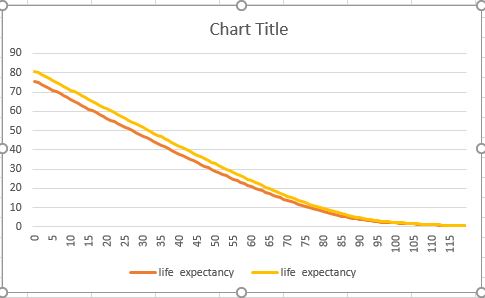
Here is a chart showing how many more years you are expected to live by age and gender. Obviously, the older you get the smaller that number is.